As designers and researchers in the digital environment we are constantly being asked to consider data in our design work. Our key question has become: How do we successfully incorporate the right data in the right ways so that users are empowered to make smarter and more insightful decisions, while not being overwhelmed by additional information or material?
I have worked on several projects that have incorporated work streams of both data and design. I wish to highlight two methodologies that I helped create within our studio:
Customer segmentation data + design research
Fjord DC Studio’s data storytelling process and templates
Customer Segmentation Data + Design Research
Role: Experience Designer & Researcher
Other Team Members: Service Designer Lead, Business Design Lead, Visual Designer
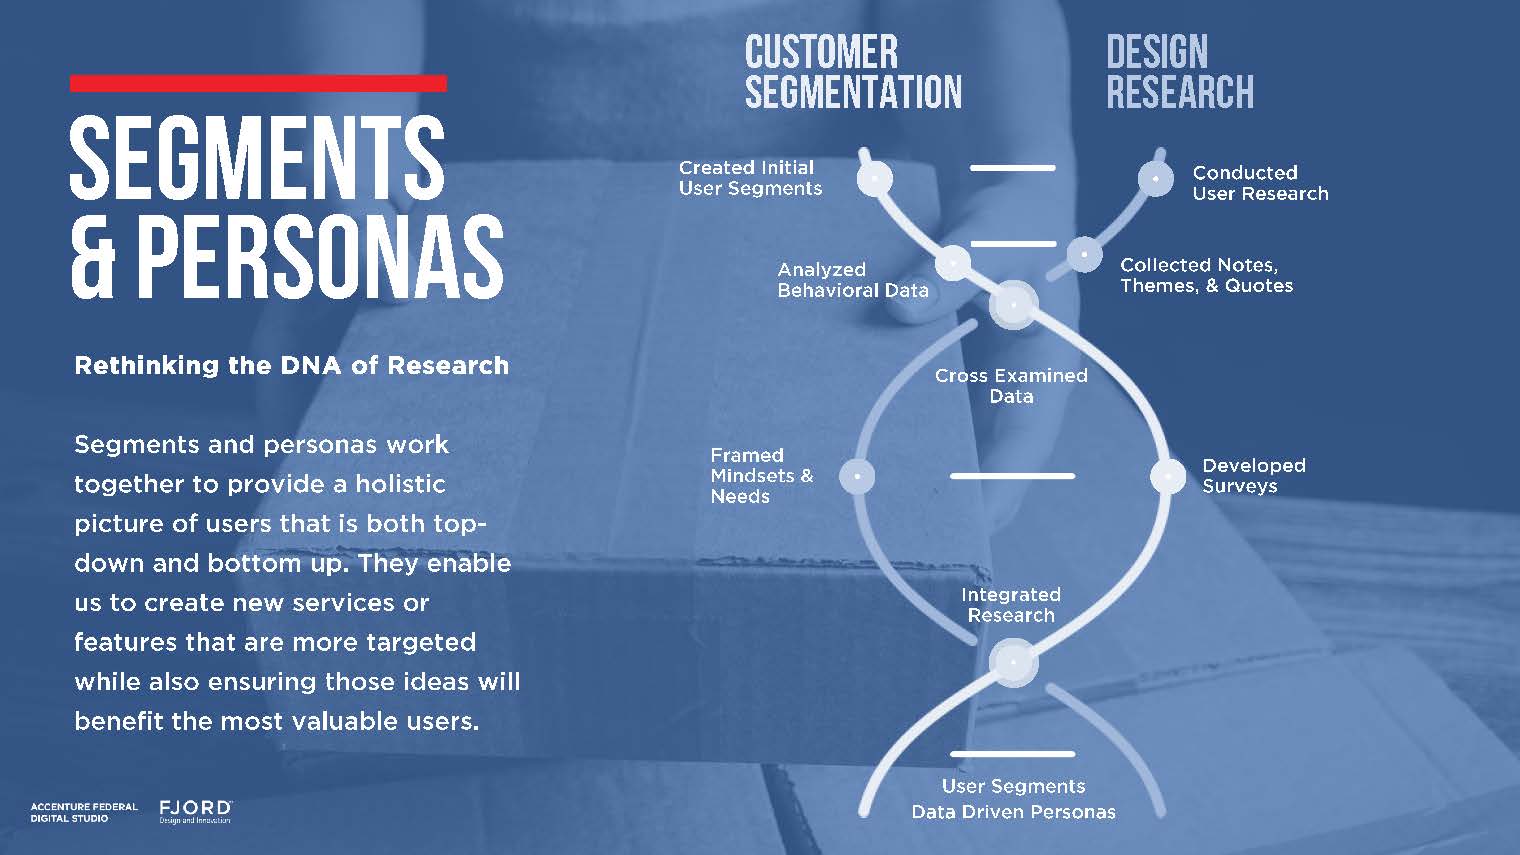
Our team was asked to conduct a multidisciplinary research project for a large national shipping service to derive insights from a customer segmentation, market research, and user and stakeholder interviews. Rather that run the research streams separately our research became woven - and at points in which our research interlaced the data, market, and user findings created opportunities for conversation between the separate project channels that became points to pivot or iterate. I wrote and illustrated the initial DNA approach to our process, which was developed and improved by my team. A sample overview of process is below:
Data Storytelling
Role: Experience/ Interaction Designer
Other Team Members: Service Designer, Data Designers (2x), Development Team, Visual Designer.
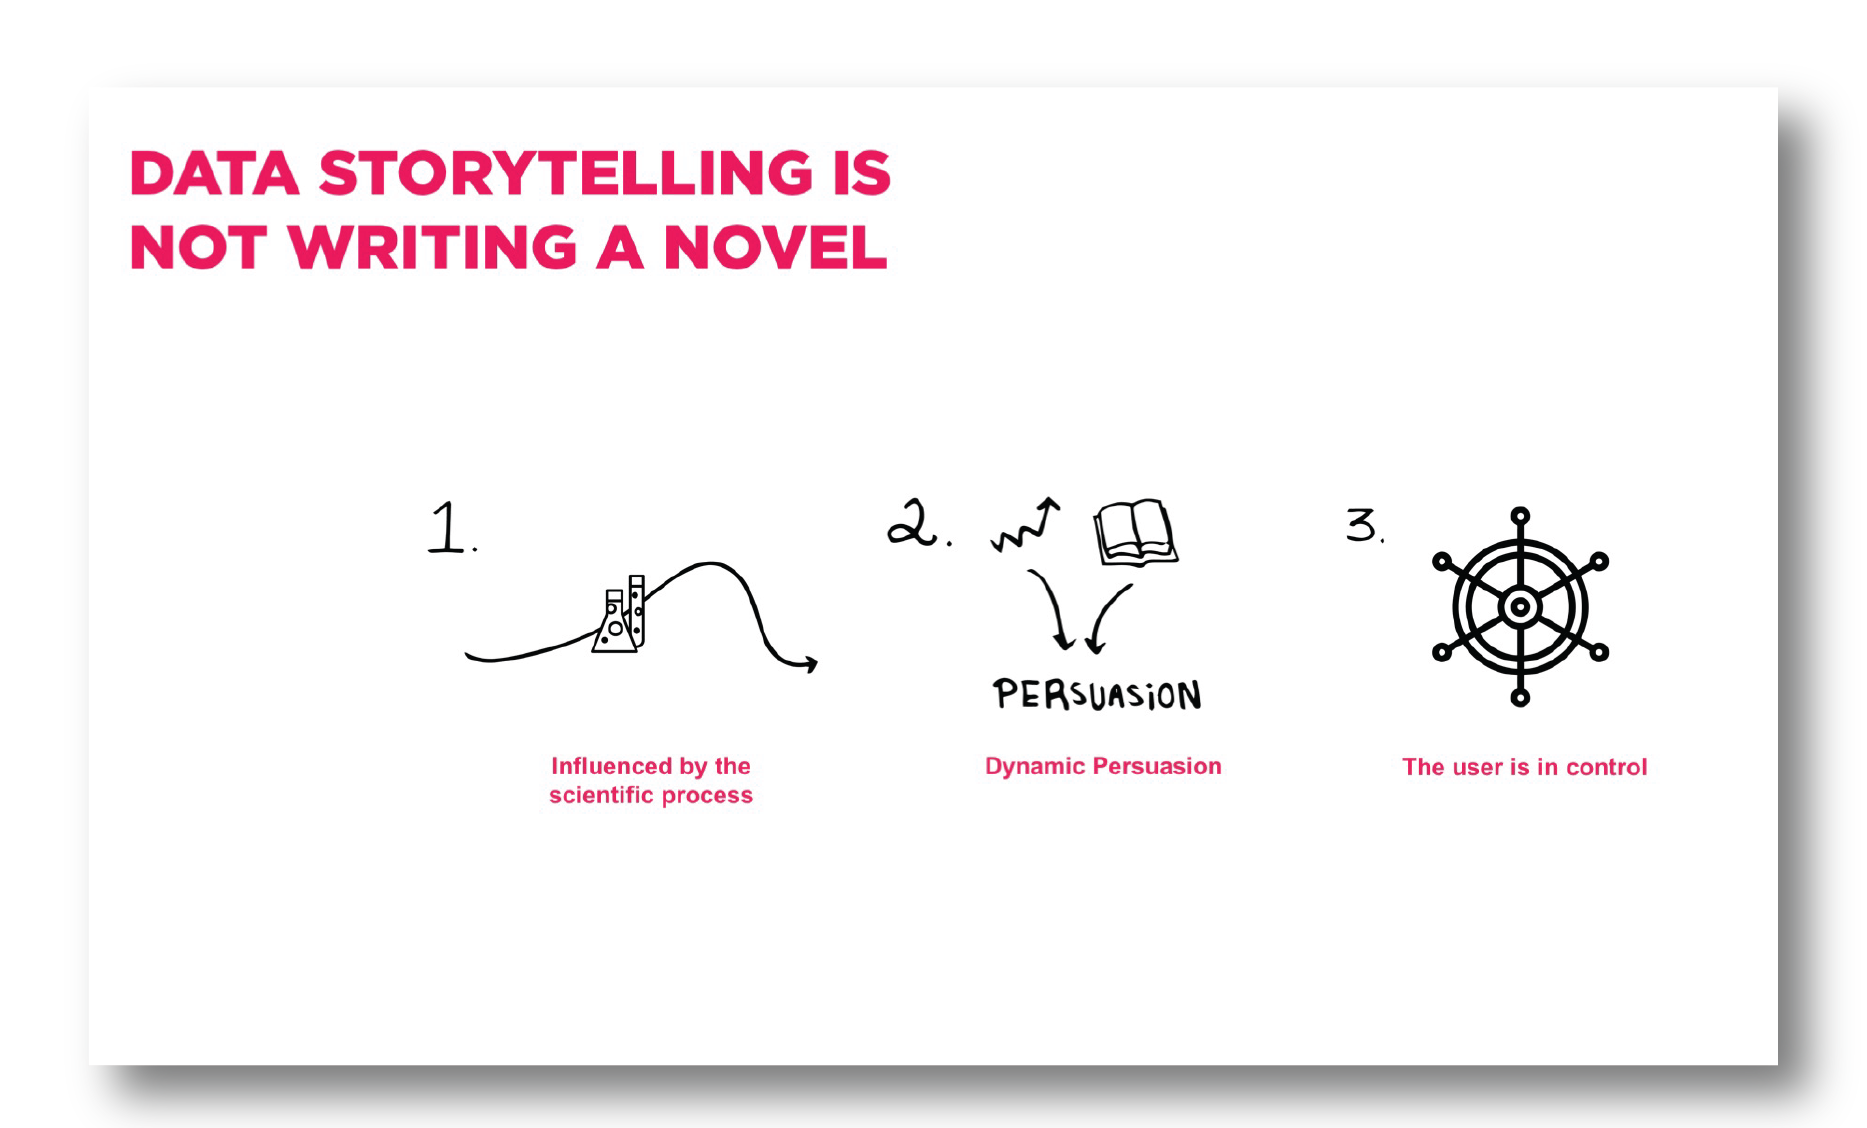
As part of a client pitch the design team was asked to incorporate open-source client data in a meaningful way. Online research revealed that our client’s department had mixed public perceptions ranging from good to very bad. We decided to combine the narrative strength of storytelling with the insightful nature of data to construct a public facing data-story that would illuminate the true nature of our client’s department.
First, to explain the process and benefits of combining data and storytelling to our clients I researched, wrote, and illustrated the following slides:


I worked closely with the service designer to create the following template. It is based off of a classic narrative arch structure, but we realized that data needed to be arranged as a series of revealing insights that build on one another, rather than as a narrative flow.

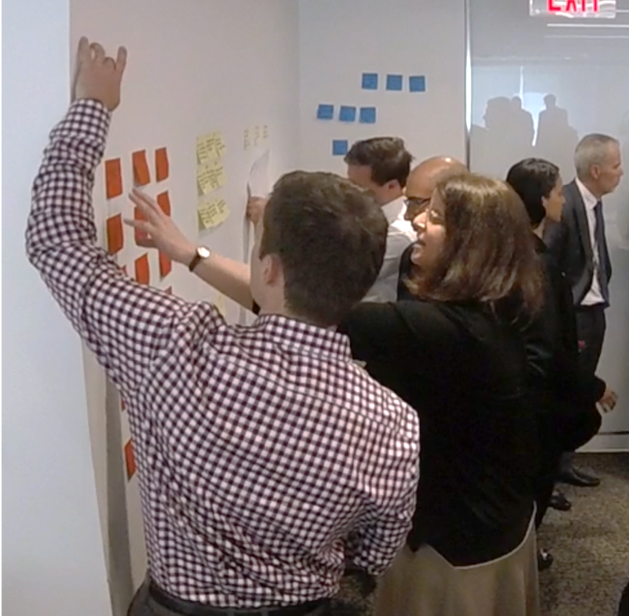
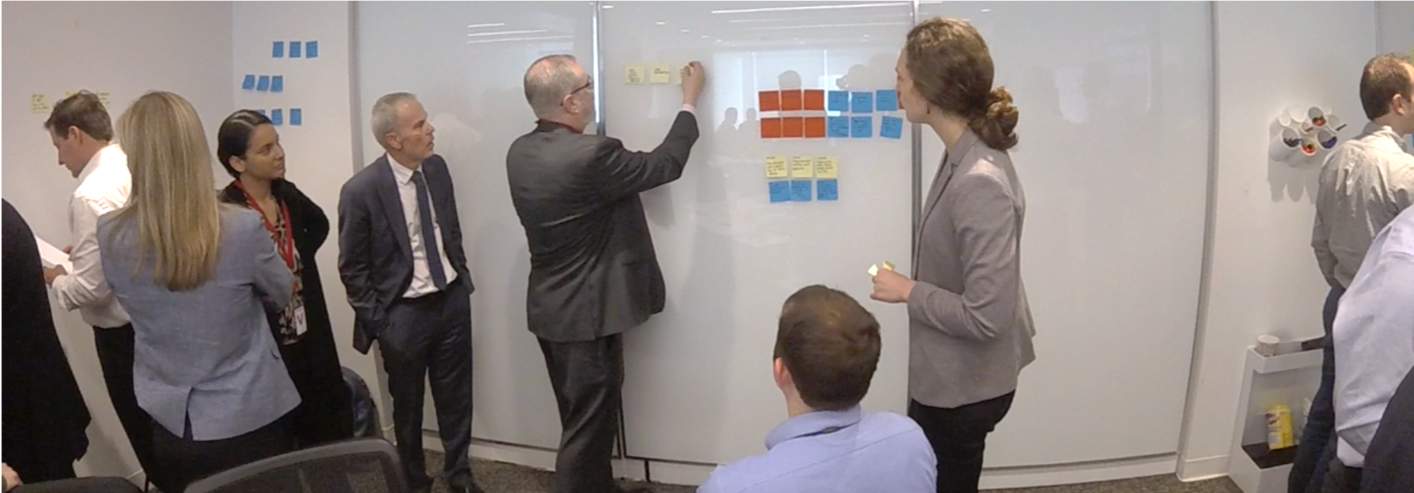
Then we researched and constructed a process and series of templates to brainstorm and build data stories with our client. We held a workshop with our client and co-created data stories with them.


At the workshop we also presented high fidelity data stories and visualizations that we built with the data designer and development team. You can interact with the designs here.


Finally, the service designer and I worked to turn this work into a teachable methodology. We presented the process and templates in a workshop we gave at the 2017 Fjord global learning summit (called Fjord Equinox) and empowered other Fjordians to become data-storytellers.
